Posted by JCharis AI
Feb. 27, 2025, 4:36 a.m.
Knowledge Graphs: A Comprehensive Guide
Knowledge graphs are powerful data structures that represent information as interconnected entities and relationships. They provide a flexible and intuitive way to organize complex data, enabling more effective information retrieval, analysis, and reasoning. In this article, we'll explore the fundamentals of knowledge graphs and demonstrate how to work with them using Python.
What is a Knowledge Graph?
A knowledge graph is a structured representation of real-world entities and their relationships. It consists of three key components:
- Nodes (Entities): Represent objects, concepts, or ideas
- Edges (Relationships): Connect nodes and describe how they are related
- Labels: Provide additional information about nodes and edges
Unlike traditional databases that store data in tables, knowledge graphs use a graph structure to capture the complex interconnections between different pieces of information. This approach allows for more flexible and dynamic data representation, making it easier to discover patterns, infer new knowledge, and answer complex queries.
Core Characteristics of Knowledge Graphs
Interlinked Descriptions of Entities
Knowledge graphs excel at representing the intricate connections between different entities. For example, in a knowledge graph about movies, you might have entities like actors, directors, and films, with relationships such as "acted in" or "directed by" connecting them.
Formal Semantics and Ontologies
Knowledge graphs often use ontologies to define the types of entities and relationships that can exist within the graph. This provides a structured framework for organizing and understanding the data.
Integration of Multiple Data Sources
One of the strengths of knowledge graphs is their ability to combine information from various sources into a unified representation. This makes them particularly useful for data integration tasks.
Scalability and Flexibility
Knowledge graphs can grow to accommodate new information without requiring significant restructuring, making them highly scalable and adaptable to changing data needs.
Building a Simple Knowledge Graph in Python
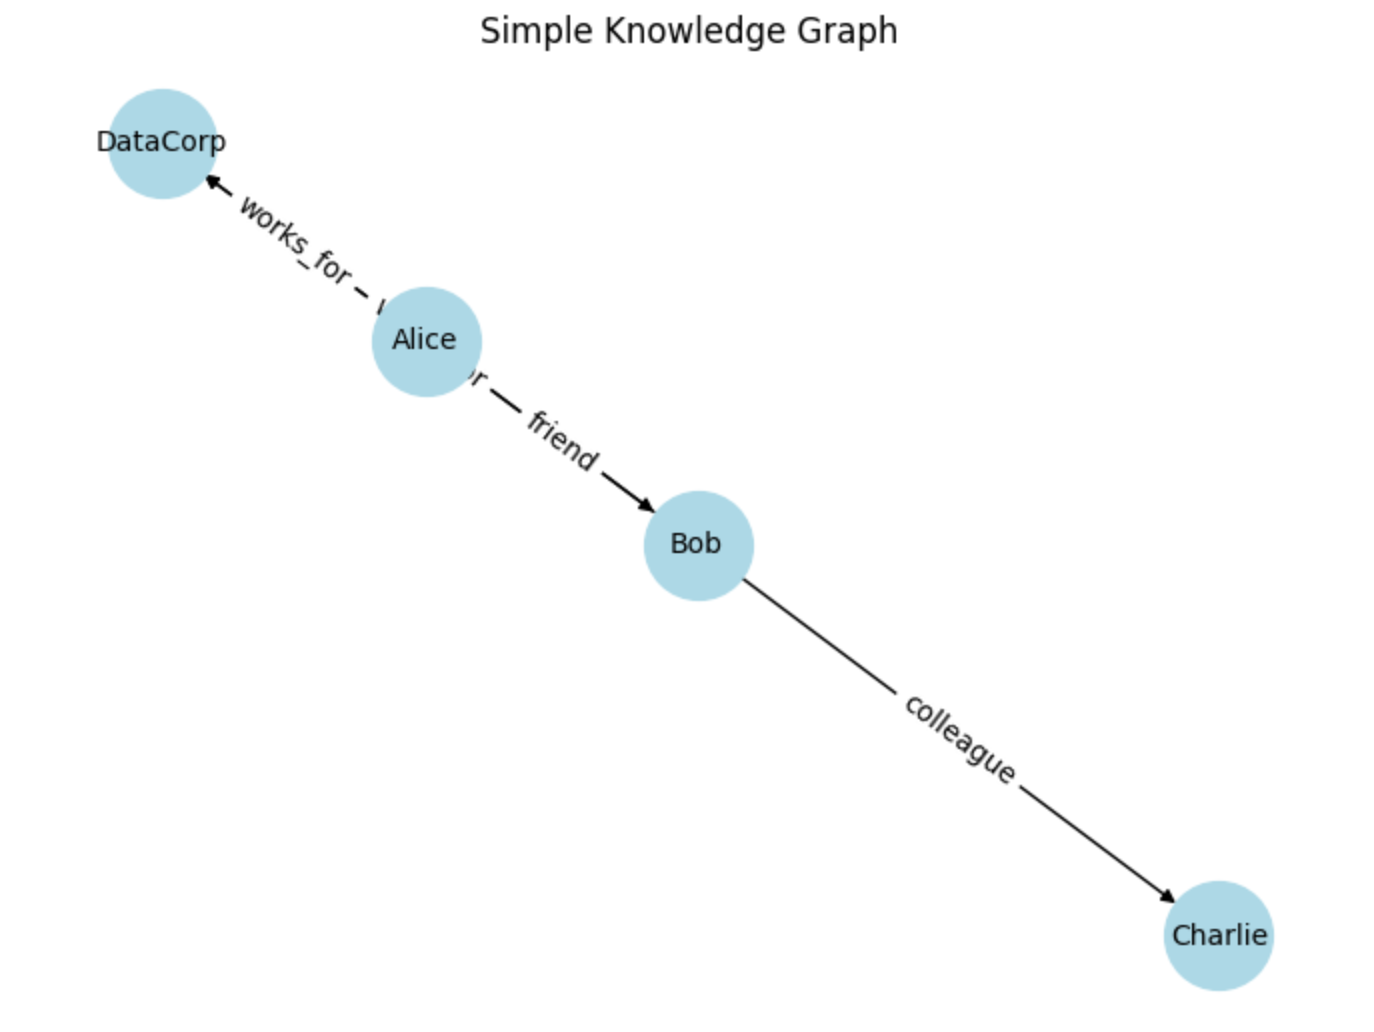
Let's create a basic knowledge graph using the NetworkX library in Python. We'll build a small graph representing relationships between people:
import networkx as nx
import matplotlib.pyplot as plt

# Create a directed graph
G = nx.DiGraph()

# Add nodes (entities)
G.add_node("Alice", type="Person")
G.add_node("Bob", type="Person")
G.add_node("Charlie", type="Person")
G.add_node("DataCorp", type="Company")

# Add edges (relationships)
G.add_edge("Alice", "Bob", relationship="friend")
G.add_edge("Bob", "Charlie", relationship="colleague")
G.add_edge("Alice", "DataCorp", relationship="works_for")
G.add_edge("Bob", "DataCorp", relationship="works_for")

# Visualize the graph
pos = nx.spring_layout(G)
nx.draw(G, pos, with_labels=True, node_color='lightblue', node_size=1500, font_size=10, arrows=True)
edge_labels = nx.get_edge_attributes(G, 'relationship')
nx.draw_networkx_edge_labels(G, pos, edge_labels=edge_labels)

plt.title("Simple Knowledge Graph")
plt.axis('off')
plt.show()
This code creates a simple knowledge graph with people and a company, along with their relationships. The resulting visualization will show the entities as nodes and their relationships as labeled edges.

Querying a Knowledge Graph
One of the powerful aspects of knowledge graphs is the ability to query and traverse relationships. Let's demonstrate how to perform some simple queries on our knowledge graph:
# Find all people who work for DataCorp
datacorp_employees = [node for node, attrs in G.nodes(data=True)
                      if attrs['type'] == 'Person' and G.has_edge(node, "DataCorp")]
print("DataCorp employees:", datacorp_employees)

# Find friends of Alice
alice_friends = [node for node in G.successors("Alice")
                 if G[("Alice", node)]['relationship'] == 'friend']
print("Alice's friends:", alice_friends)

# Find the relationship between Bob and Charlie
bob_charlie_relationship = G[("Bob", "Charlie")]['relationship']
print("Relationship between Bob and Charlie:", bob_charlie_relationship)
This code demonstrates how to traverse the graph to answer specific questions about the relationships between entities.
Advanced Knowledge Graph Techniques
Entity Extraction and Relationship Identification
In real-world applications, building knowledge graphs often involves extracting entities and relationships from unstructured text. Here's a simple example using spaCy for named entity recognition:
import spacy

nlp = spacy.load("en_core_web_sm")

text = "Apple Inc. was founded by Steve Jobs in Cupertino, California."
doc = nlp(text)

# Extract entities
entities = [(ent.text, ent.label_) for ent in doc.ents]
print("Extracted entities:", entities)

# Identify relationships (simplified)
for token in doc:
    if token.dep_ == "nsubj" and token.head.pos_ == "VERB":
        subject = token.text
        verb = token.head.text
        for child in token.head.children:
            if child.dep_ == "dobj":
                obj = child.text
                print(f"Relationship: {subject} - {verb} - {obj}")
This code uses spaCy to extract named entities and identify simple subject-verb-object relationships from text, which could be used to populate a knowledge graph.
Using RDF and SPARQL
For more complex knowledge graphs, especially those used in semantic web applications, Resource Description Framework (RDF) and SPARQL are commonly used. Here's an example using the rdflib library:
from rdflib import Graph, Literal, RDF, URIRef
from rdflib.namespace import FOAF, XSD

# Create a graph
g = Graph()

# Create URIs for our resources
alice = URIRef("http://example.org/alice")
bob = URIRef("http://example.org/bob")

# Add triples to the graph
g.add((alice, RDF.type, FOAF.Person))
g.add((alice, FOAF.name, Literal("Alice")))
g.add((alice, FOAF.age, Literal(30, datatype=XSD.integer)))
g.add((alice, FOAF
.knows, bob))
g.add((bob, RDF.type, FOAF.Person))
g.add((bob, FOAF.name, Literal("Bob")))

# Perform a SPARQL query
query = """
SELECT ?name ?age
WHERE {
    ?person rdf:type foaf:Person .
    ?person foaf:name ?name .
    OPTIONAL { ?person foaf:age ?age }
}
"""

results = g.query(query)

for row in results:
    print(f"Name: {row.name}, Age: {row.age if row.age else 'Unknown'}")
This example demonstrates how to create an RDF graph and query it using SPARQL, which is a powerful query language specifically designed for knowledge graphs.
Real-World Applications of Knowledge Graphs
Knowledge graphs have numerous practical applications across various industries:
1. Search Engines and Information Retrieval
Google's Knowledge Graph enhances search results by providing structured and detailed information about entities directly in search results.
2. Recommendation Systems
E-commerce platforms like Amazon use knowledge graphs to improve product recommendations by understanding relationships between products, user preferences, and purchasing patterns.
3. Fraud Detection
Financial institutions employ knowledge graphs to detect complex fraud patterns by analyzing relationships between transactions, accounts, and individuals.
4. Drug Discovery
Pharmaceutical companies utilize knowledge graphs to integrate diverse biomedical data, helping researchers identify potential drug targets and predict drug interactions.
Implementing a More Complex Knowledge Graph
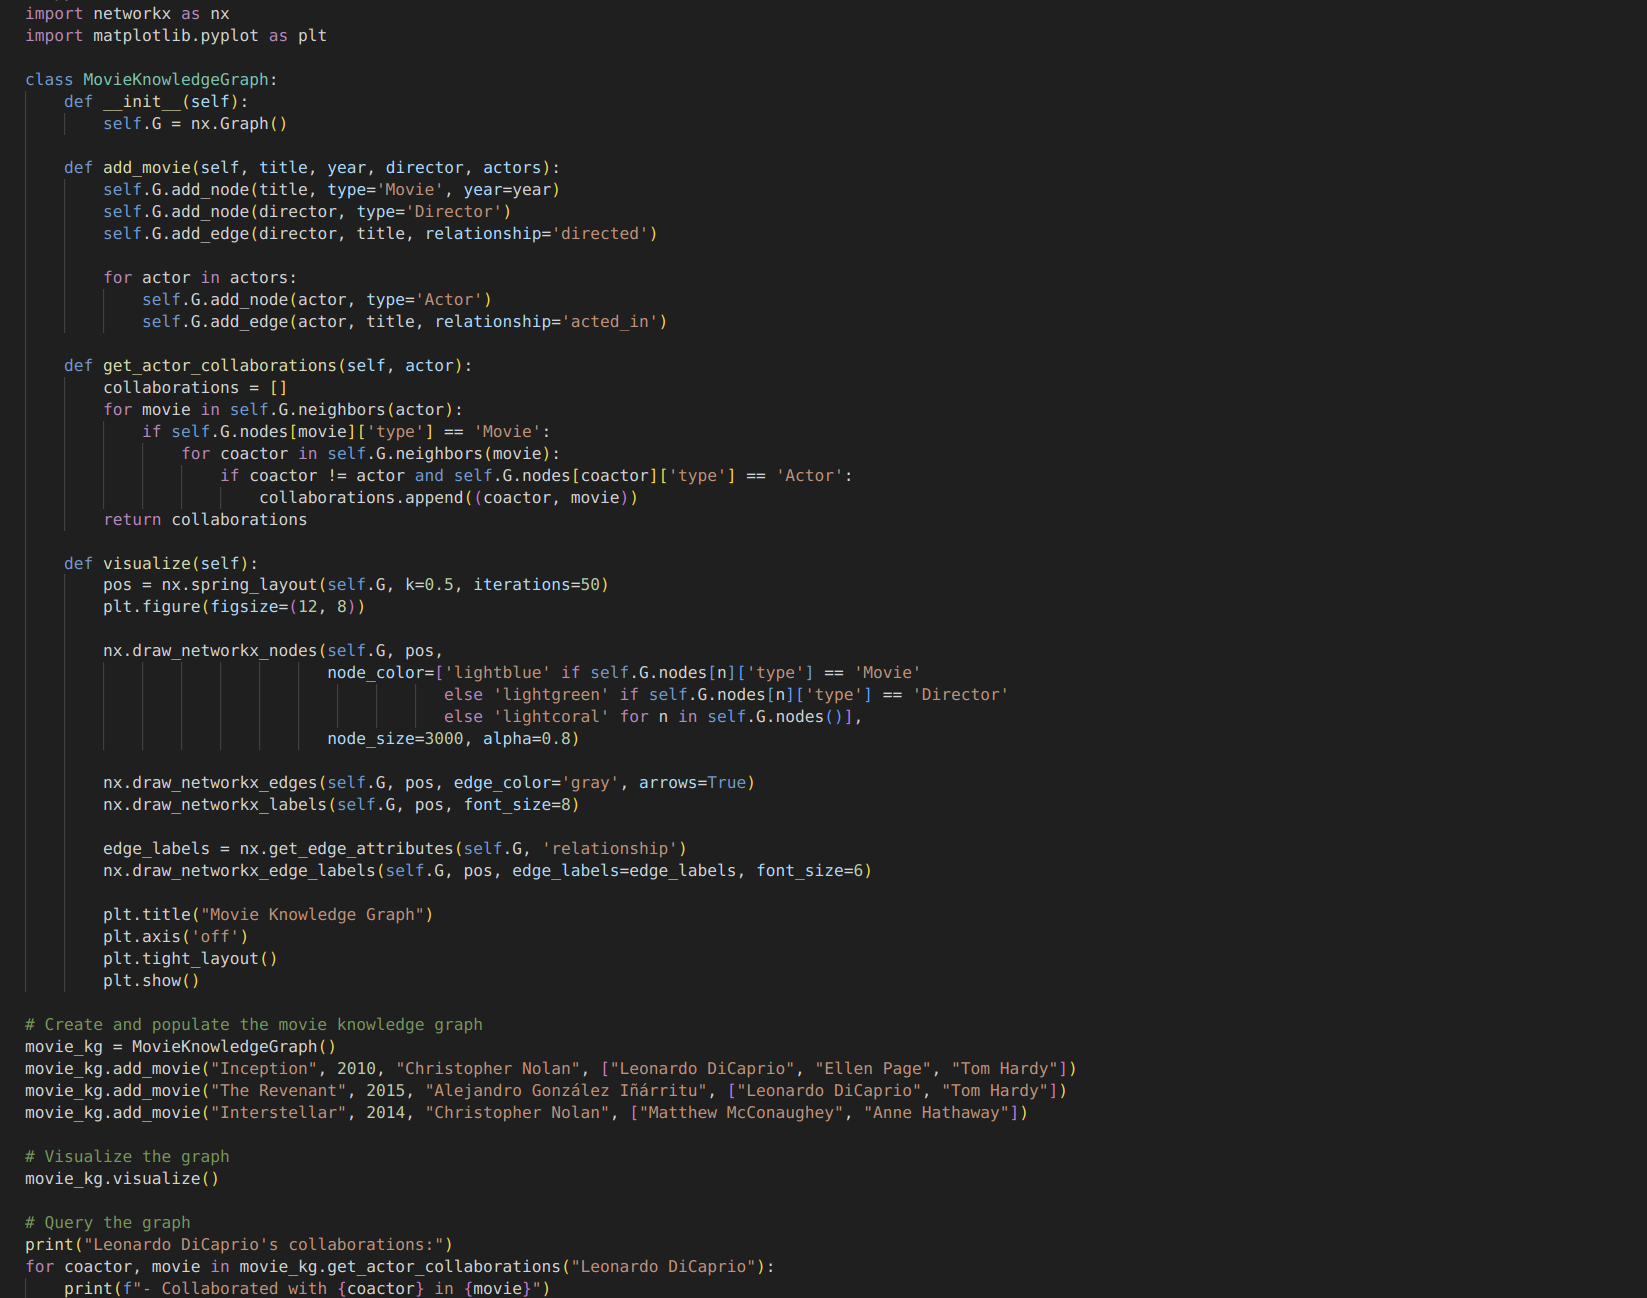
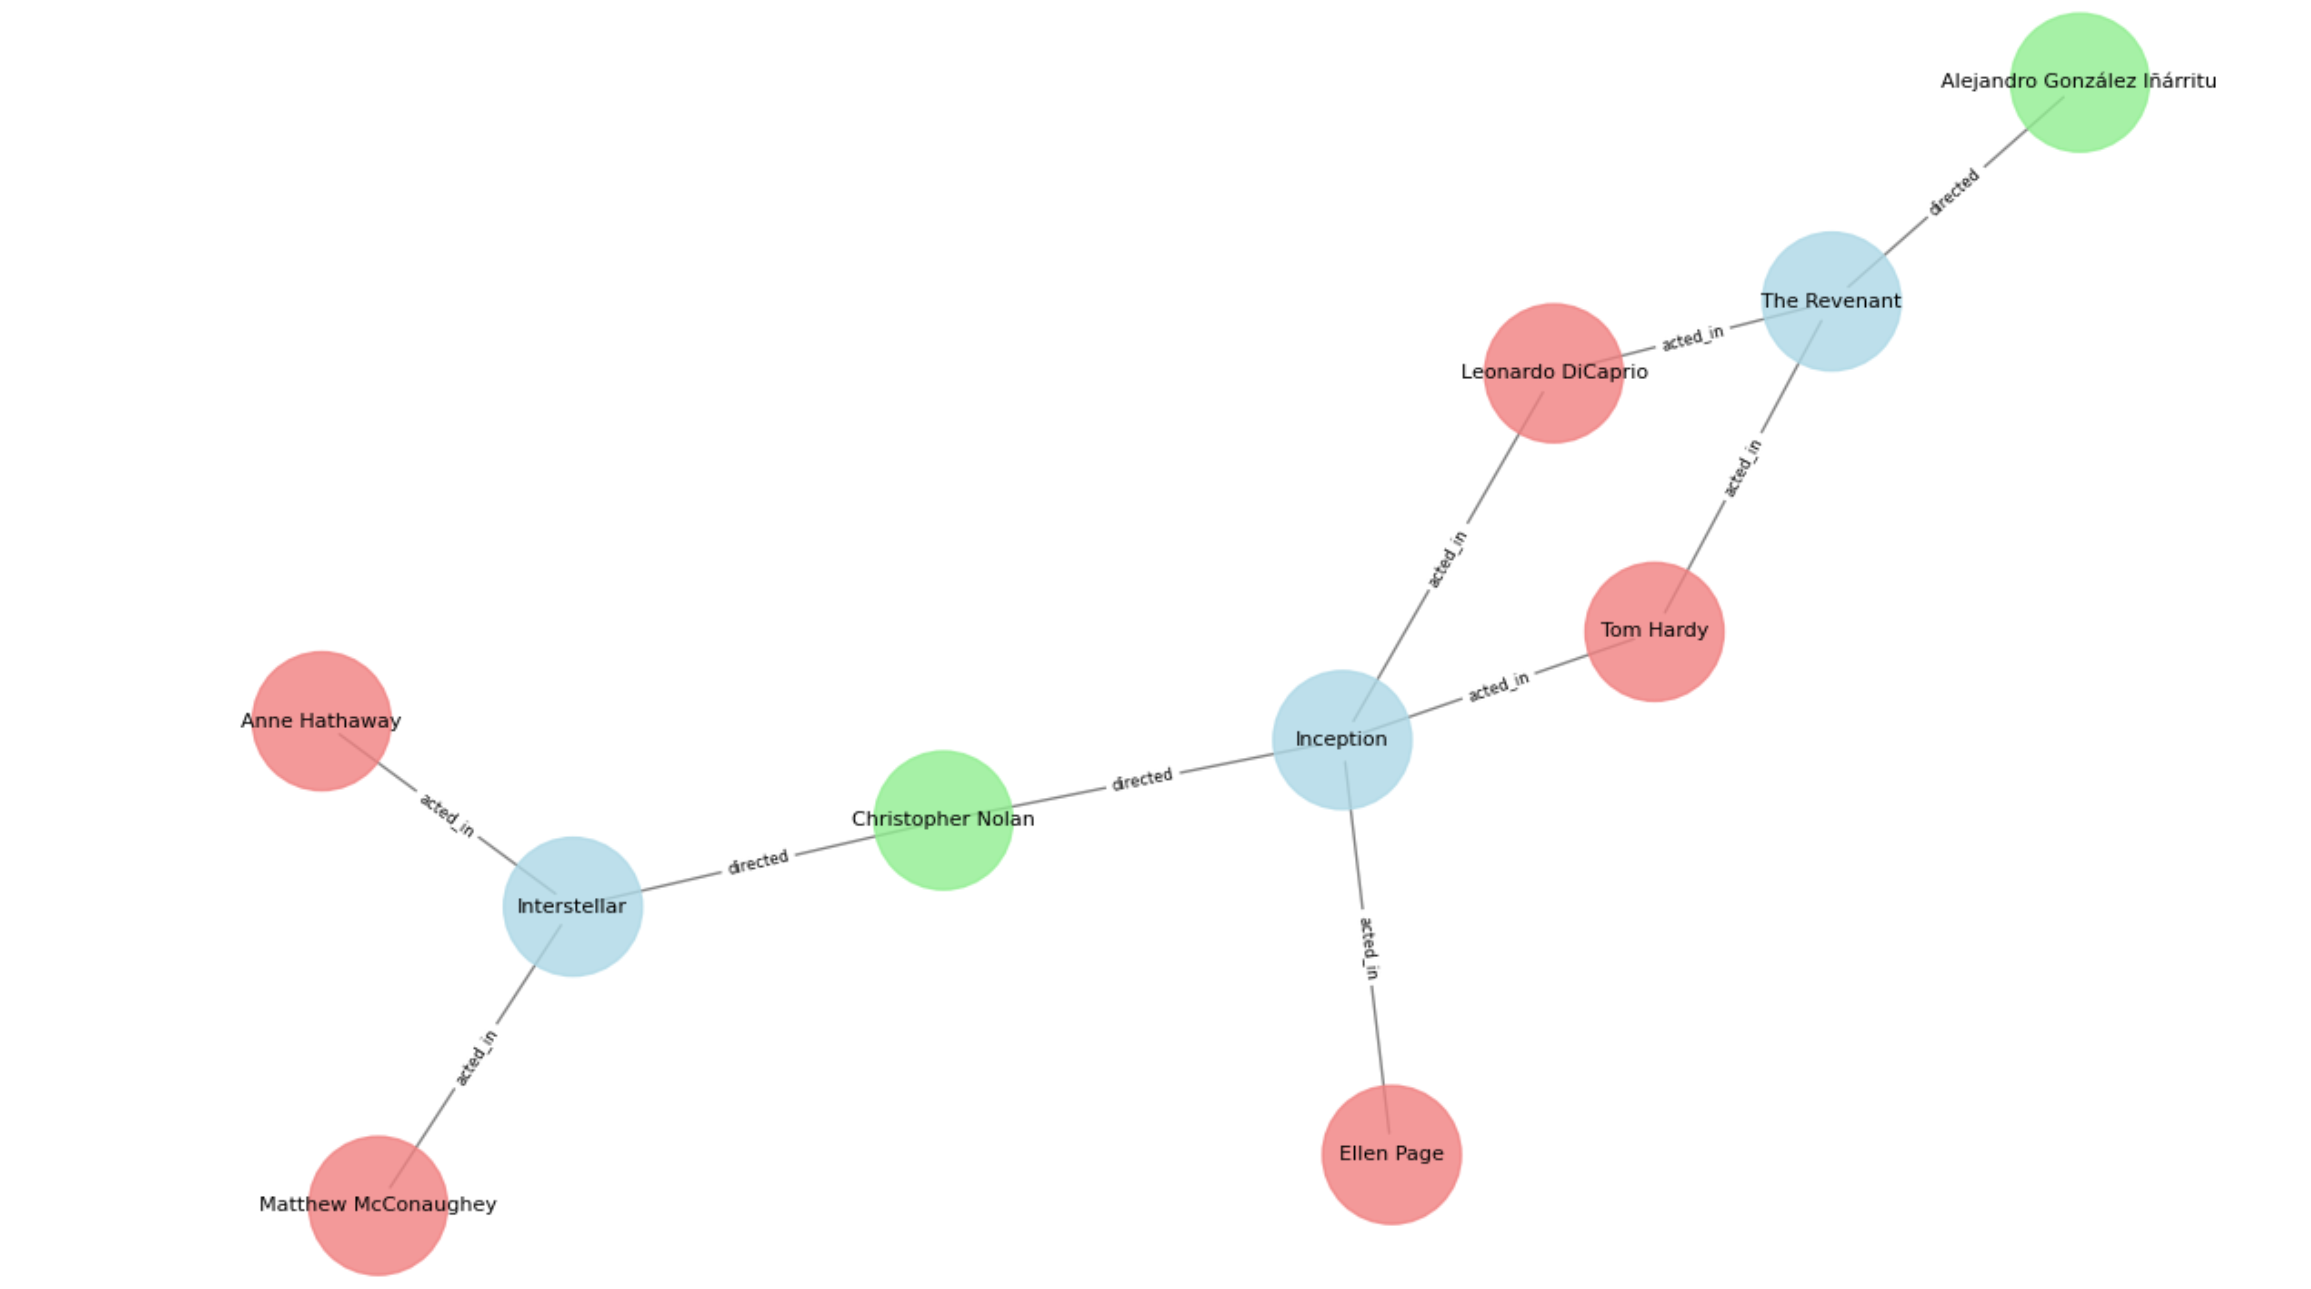
Let's create a more sophisticated knowledge graph representing a movie database:
import networkx as nx
import matplotlib.pyplot as plt

class MovieKnowledgeGraph:
    def __init__(self):
        self.G = nx.Graph()

    def add_movie(self, title, year, director, actors):
        self.G.add_node(title, type='Movie', year=year)
        self.G.add_node(director, type='Director')
        self.G.add_edge(director, title, relationship='directed')

        for actor in actors:
            self.G.add_node(actor, type='Actor')
            self.G.add_edge(actor, title, relationship='acted_in')

    def get_actor_collaborations(self, actor):
        collaborations = []
        for movie in self.G.neighbors(actor):
            if self.G.nodes[movie]['type'] == 'Movie':
                for coactor in self.G.neighbors(movie):
                    if coactor != actor and self.G.nodes[coactor]['type'] == 'Actor':
                        collaborations.append((coactor, movie))
        return collaborations

    def visualize(self):
        pos = nx.spring_layout(self.G, k=0.5, iterations=50)
        plt.figure(figsize=(12, 8))

        nx.draw_networkx_nodes(self.G, pos,
                               node_color=['lightblue' if self.G.nodes[n]['type'] == 'Movie'
                                           else 'lightgreen' if self.G.nodes[n]['type'] == 'Director'
                                           else 'lightcoral' for n in self.G.nodes()],
                               node_size=3000, alpha=0.8)

        nx.draw_networkx_edges(self.G, pos, edge_color='gray', arrows=True)
        nx.draw_networkx_labels(self.G, pos, font_size=8)

        edge_labels = nx.get_edge_attributes(self.G, 'relationship')
        nx.draw_networkx_edge_labels(self.G, pos, edge_labels=edge_labels, font_size=6)

        plt.title("Movie Knowledge Graph")
        plt.axis('off')
        plt.tight_layout()
        plt.show()

# Create and populate the movie knowledge graph
movie_kg = MovieKnowledgeGraph()
movie_kg.add_movie("Inception", 2010, "Christopher Nolan", ["Leonardo DiCaprio", "Ellen Page", "Tom Hardy"])
movie_kg.add_movie("The Revenant", 2015, "Alejandro González Iñárritu", ["Leonardo DiCaprio", "Tom Hardy"])
movie_kg.add_movie("Interstellar", 2014, "Christopher Nolan", ["Matthew McConaughey", "Anne Hathaway"])

# Visualize the graph
movie_kg.visualize()

# Query the graph
print("Leonardo DiCaprio's collaborations:")
for coactor, movie in movie_kg.get_actor_collaborations("Leonardo DiCaprio"):
    print(f"- Collaborated with {coactor} in {movie}")
This example creates a more complex knowledge graph representing movies, directors, and actors. It demonstrates how to add structured data to the graph, visualize it, and perform queries to extract meaningful information.


Challenges and Future Directions
While knowledge graphs offer powerful capabilities, they also present some challenges:
Data Quality and Consistency: Ensuring the accuracy and consistency of data across large knowledge graphs can be challenging.
Scalability: As knowledge graphs grow, efficient storage and querying become increasingly important.
Integration of Unstructured Data: Incorporating unstructured data (like text) into knowledge graphs often requires advanced natural language processing techniques.
Reasoning and Inference: Developing algorithms for effective reasoning and inference over large-scale knowledge graphs is an active area of research.
Future directions in knowledge graph research and applications include:
- Explainable AI: Using knowledge graphs to provide more interpretable and explainable AI systems.
- Multimodal Knowledge Graphs: Integrating different types of data (text, images, video) into unified knowledge representations.
- Dynamic Knowledge Graphs: Developing methods to efficiently update and maintain knowledge graphs in real-time as new information becomes available.
Conclusion
Knowledge graphs represent a powerful approach to organizing and leveraging complex, interconnected data. By providing a flexible and intuitive way to represent relationships between entities, they enable more sophisticated data analysis, information retrieval, and decision-making processes. As demonstrated in the Python examples, knowledge graphs can be implemented and queried using various tools and libraries, making them accessible for a wide range of applications. As research in this field continues to advance, we can expect knowledge
No tags associated with this blog post.
NLP Analysis
- Sentiment: positive
- Subjectivity: positive
- Emotions: joy
- Probability: {'anger': 1.160209554732982e-173, 'disgust': 1.6647386697206096e-205, 'fear': 6.874470910991949e-193, 'joy': 1.0, 'neutral': 0.0, 'sadness': 2.2878674346482604e-132, 'shame': 2.26342125516689e-309, 'surprise': 2.7171412807470264e-209}